Some Beginning Thoughts and Pointers on Qualitative Methodologies and Analysis
I didn’t start out trying to write a post on this, but I’ve gotten enough questions along the lines of “Do you have any coding advice?” (nothing to do with source code), “Can I see your coding manual?” (still nothing to do with source code), and “Do you have any tips on how to make analysis of interview data more rigorous?” that I wanted to throw some excerpts from my replies together in one place. As a result, I wouldn’t call this a complete or smooth introduction, but hopefully one that is still helpful to some. This is written from the perspective of someone giving advice to qualitative-curious computer scientists who are more comfortable with quantitative analysis (but not necessarily statistics).
At a high level
If you’re coming in to this area fairly fresh, keep in mind the good, the bad, and the ugly.
-
The good: There are lots and lots of resources on how to improve your methodology if you want to dig into it — many, many people have thought about it. And you should always try, even if you know it isn’t going to be perfect on the first try!
-
The bad: Beware hubris. You are not going to become an instant expert, and there’s always going to be more to learn. Also, while “all that stuff” might look the same to us CS types, there are actually a lot of different subfields to draw from that have varying intensities of philosophical differences.
-
The ugly: As either a reader or a writer, there is never going to be enough space in a publication to go into enough detail on the methodology that you can have 100% (or 99%, or 98%…) confidence that the research was performed with all due attention to validity and reliability. The best that can be done is to describe enough steps or details to give confidence that the researcher: a) has an idea of ways that reliability and validity can be achieved; and b) applied critical thinking and paid attention to details.
Why Even Do Qualitative Research?
Every study methodology or study design has particular limitations and capabilities. This is particularly in the context of:
- how generalizable the results are;
- how much you can control for specific variables;
- how much the results reflect the real world.
A 1994 article by McGrath, “Methodology Matters: Doing Research in the Behavioral and Social Sciences,” talks a bit about this. You will also see papers referring variously to reliability, validity, internal validity, external validity, and ecological validity. You might get slightly different definitions if you talk to different people, but as a general guideline:
- Reliability: What evidence do you have that, if you did what you did again, you would get the same results?
- Validity: How “real” are the results that you’re getting?
- Internal Validity: Are your claimed results supported by your study, or are there other confounding factors?
- External Validity: How generalizable are your results? They may be valid for your population, but are they also valid for population X?
- Ecological Validity: Do your (e.g., lab) results have anything to do with how people act and how things happen in the real world?
A (quantitative) internal validity example: I am testing whether people are happier about filing paperwork when they are given breaks. I assign all participants randomly to either condition A (no break between the two assigned filing tasks) or condition B (a break between filing tasks). During the break participants can wander around the room, go to the bathroom, or help themselves to cookies and milk (supplied as a courtesy). At the end of the study, I give participants a (previously-validated) survey that measures their level of satisfaction with the filing tasks. I find that participants assigned to condition B express significantly higher levels of satisfaction than those in condition A. I therefore conclude that giving breaks leads to higher satisfaction.
In reality, any number of things could be contributing to this finding. For example, maybe people are just happier when you give them cookies and milk. Or maybe most of your participants in condition B chose to walk around, thereby raising their heart rates, and the residual effects made them more satisfied. Maybe you would get the same results if you gave them no break, but force fed them milk-soaked cookies as they filed while walking on a treadmill.
This study has issues with internal validity, given that there are many other confounding factors that could have contributed to the measured results.
For people with a background in more quantitative methods, embracing qualitative approaches to reliability and validity can feel uncomfortable at first. It doesn’t help that (at least in the education I received) we’re taught from a young age that research = science = an idealized version of the scientific method. (As an aside, research ≠ science ≠ scientific method. You can jump down a very deep rabbit hole by looking into epistemology.)
I’ve heard several times — although I don’t know where to credit — metaphors regarding lamplights or spotlights. The general idea is that quantitative data collection, while immensely satisfying in terms of getting numbers that you can play with, tends to only measure things that are easily instrumented (i.e., located within the light). Sometimes the things you want to learn are outside the spotlight (i.e., in the dark) and not easily instrumented or well understood. There’s a fun talk to this effect on data fetishism from Judd Antin at Facebook.
This leads to the general idea of using mixed methods or triangulation of methods — getting at the underlying data and results by taking advantage of the strengths and weaknesses of different methods.
Help! I Don’t Know What I Want to Do
Universal Methods of Design: 100 Ways to Research Complex Problems, Develop Innovative Ideas, and Design Effective Solutions (Hanington and Martin) is a useful resource that gives a very brief overview of 100 methods that might help out at different stages in the research process (e.g., A/B testing, affinity diagramming, concept mapping, crowdsourcing….). It’s aimed at the Design process, but a lot of methods are similarly applicable to research. It can be handy during your study design to flip through and see if any of the methods would work particularly well for you.
Some nice blog posts
From Katie Kuksenok (hi, Katie!):
- How I Do User Research: A combination guide and “how I work”
- The tl;dr summary of topics at the top of the post:
- How to Ask Research Questions (write it down, iterate)
- How to Conduct Exploratory Interviews (it’s usually worth doing, and the way to interview well is to be flexible and an active listener)
- How to Interview to Evaluate a Prototype (be specific, and ask user study participants to compare and contrast, not to criticize)
- How to Compose a Survey (keep it short and simple, don’t force opinions, have at least one open-ended prompt for “debugging”)
- How to Discover Themes (qualitative analysis is a systematic way of using the human capacity to categorize things)
- How to Use Theory and Related Research (if you want to incorporate scientific research, here’s some general ideas on how to approach that)
- Fundamental Principles of User Research (or, what I think the fundamental principles ought to be)
- The tl;dr summary of topics at the top of the post:
- One Coder Coding (On minimizing software tooling for qualitative data analysis tools from a programmer who does a particular kind of qualitative user research)
Question Wording
These are fairly high-level and are written from the angle of interviewing/surveying to improve commercial products (so take with a grain of salt), but they’re also a fairly brief introduction to things to keep in mind when writing surveys/interviews.
- Observing the User Experience (Goodman et al)
- Chapter 6. Interviews
- Chapter 12. Surveys
Coding Advice
In the context of qualitative analysis, codes are words or short phrases that, essentially, tag a section of the collected data (where the collected data can be things like interview transcripts, participant diaries, observer notes, or video recordings). What constitutes the set of codes which you can apply — and the conditions under which you apply them to a section of the data — is known as the coding manual or the coding rubric. (There are more details here: for example, do you allow parallel/nested codes to be applied to overlapping areas of the data?)
“Coding” is an overloaded term that can both refer to the interpretative/analytic process of creating the coding rubric/manual (Figure 1) as well as to the more mechanical (but sometimes still frustratingly interpretative process) of applying the finalized manual to the data corpus (Figure 2). There are a lot of different processes for creating a manual – none are mechanical, but they might be designed to give more structure to the process and/or to help you challenge assumptions, reconcile different researchers’ points of view, etc. One semi-popular method is grounded theory, e.g.: http://www.amazon.com/Constructing-Grounded-Introducing-Qualitative-Methods/dp/0857029142.
Coding is an iterative process. As you start to create the coding manual from the data, you will find that codes need to be added, merged, split, or redefined. It should be very iterative, with lots of tweaking and arguing (and you’re supposed to take notes about why you choose what you do). Try to ask yourself a lot why you’re doing what you’re doing, how you could do it differently, what nuances it might be masking, what it means in terms of the claims you can make and the claims you can’t make, etc. It is also acceptable (even normal) to start to create the coding manual from collected data while data collection is still underway. Figure 1 provides a rough sketch of what the coding process might look like, from start to finish.
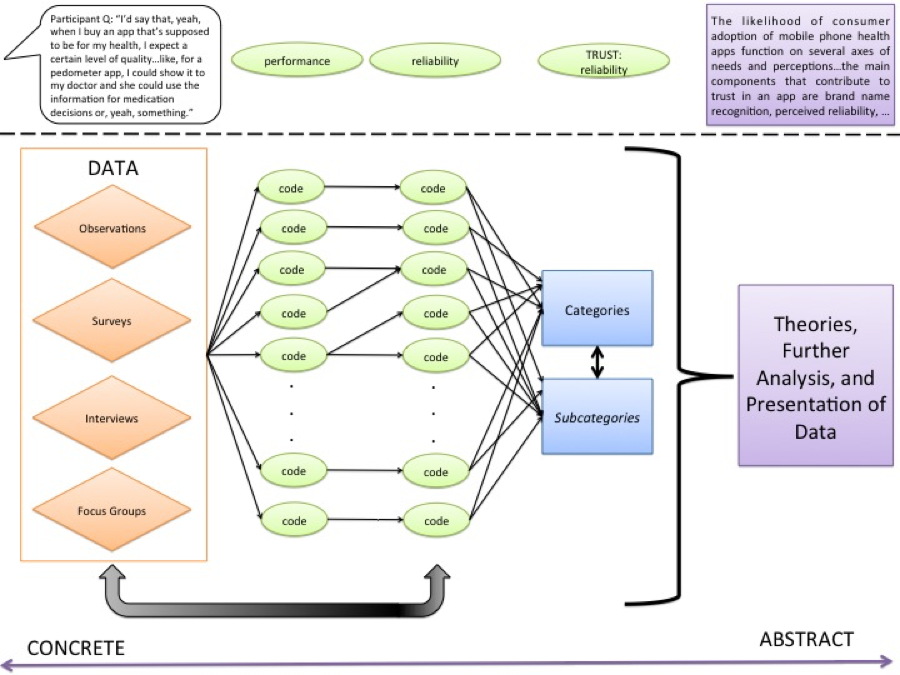 Figure 1. Representation of a qualitative research process, from data to theory.
In general, you should guide yourself by asking, “What am I trying to learn about? What do I want to be able to say about the data?” There is going to be way more information than you’re going to be extracting. You could care about extracting usage of metaphors, intensity of emotions (with audio transcripts), etc. (You probably aren’t, but you could be.) You are not going to be analyzing everything — it’s by nature an evidence of presence, not a proof of coverage or a proof of absence.
Coding is analysis, since it’s a subjective act that manipulates, describes, and/or categorizes the data through the researcher’s lens. That being said, the results of coding will generally be used for further analysis, working towards themes and hypotheses in general, and for the presentation of data in such forms as:
- A list of most-salient issues
- A flowchart modeling the decisions that users will make under certain conditions, or a flowchart of other mental processes
- Frequency counts, either of:
- instances that codes appear overall, by participant, location, or other entity
- instances that unique participants, locations, or other entities raise a code
It will probably make sense to have 2+ researchers make passes through the data with initial coding, focusing on whatever your research goals/questions are (with wiggle room for “wow that’s interesting”), then have them meet and try to hash things out with great deliberation and justification. Depending on how much data you have, you might want to use a system like Dedoose or Atlas.ti (which lets you collaborate, link, and…er…refactor?).
In two of my papers, I ended up supplying counts of participants who brought up codes (via the coding of their interview content). This serves as a rough indication of how prevalent an issue was among participants but, depending on the study design, can be more of a meaningless measure — one that is just put in to make a certain kind of reader more comfortable with what you’re presenting and to help remind them that what they’re reading in the results section, which essentially looks like an essay, is actually grounded in data.
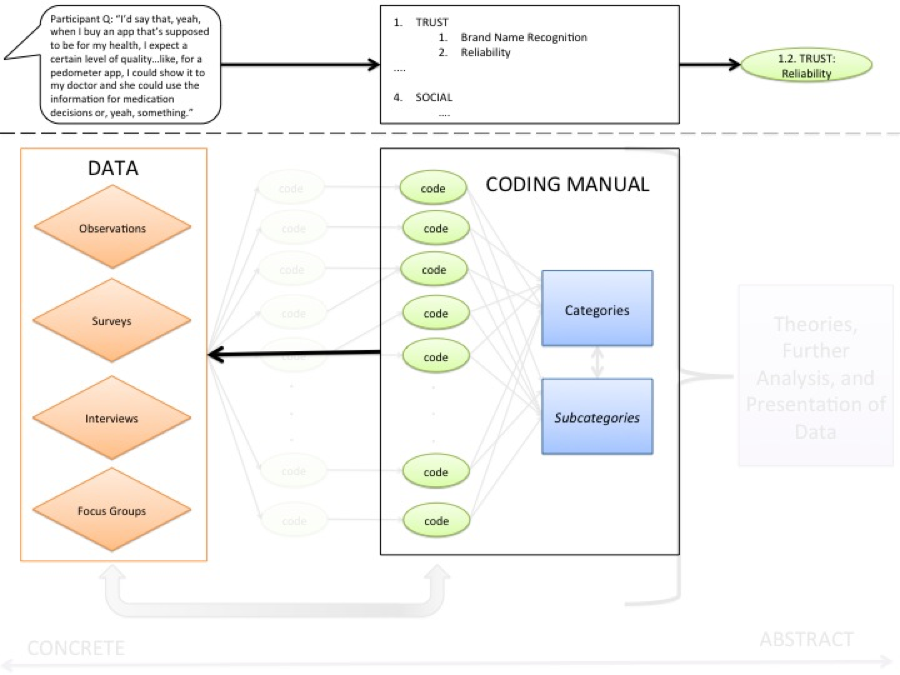 Figure 2. The application of a coding manual to code the data.
There are many different approaches you can take to reliability coding. For example, for comparative purposes: an unrelated researcher, using your coding manual, codes all data; different researchers on the team divide up the data and code it individually, but a certain percentage of the data receives overlapping coding; a final coding manual is developed using a fraction of the data, and the manual is applied to the remainder of the data; etc. Looking at Cohen’s kappa to present the inter-coder rating is usually a good starting point since — as opposed to straightforward percent agreement — it helps account for how likely a particular coder is to mark a particular code as present.
One of the problems with this kind of data analysis is that there’s not a great way from outside the team to tell whether the analysis process was full of intense and thoughtful deliberation or slapdash. Of course, you could say the same about a lot of quantitative research.